From Wikipedia, the free encyclopedia
→List of heads of state
Monarchy of South Africa[edit]
1910 general election[edit]
1910 South African general election|
|
|
|
|
|
1915 general election[edit]
1915 South African general election|
|
|
| Registered | 365,307 |
|---|
| Turnout | 261,433 (71.57%) |
|---|
|
|
First party
|
Second party
|
|
|
|
|
| Leader
|
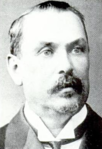
Louis Botha
|
Thomas Smartt
|
| Party
|
South African
|
Unionist
|
| Last election
|
28.45%, 66 seats
|
37.65%, 36 seats
|
| Seats won
|
54
|
39
|
| Seat change
|
 12 12
|
 3 3
|
| Popular vote
|
94,285
|
49,917
|
| Percentage
|
36.67%
|
19.41%
|
| Swing
|
8.22pp
|
18.24pp
|
|
|
|
Third party
|
Fourth party
|
|
|
|
|
| Leader
|
Barry Hertzog
|
Frederic Creswell
|
| Party
|
National
|
Labour
|
| Last election
|
Did not exist
|
10.93%, 3 seats
|
| Seats won
|
27
|
4
|
| Seat change
|
New party
|
1
|
| Popular vote
|
75,623
|
24,755
|
| Percentage
|
29.41%
|
9.63%
|
| Swing
|
New party
|
1.30pp
|
|
|
1920 general election[edit]
1920 South African general election|
|
|
| Registered | 421,790 |
|---|
| Turnout | 282,361 (66.94%) |
|---|
|
|
First party
|
Second party
|
|
|

|
|
| Leader
|
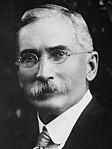
Jan Smuts
|
Barry Hertzog
|
| Party
|
South African
|
National
|
| Last election
|
36.67%, 54 seats
|
29.41%, 27 seats
|
| Seats won
|
43
|
42
|
| Seat change
|
12
|
15
|
| Popular vote
|
101,227
|
90,512
|
| Percentage
|
36.48%
|
32.62%
|
| Swing
|
0.19pp
|
3.21pp
|
|
|
|
Third party
|
Fourth party
|
|
|
|
|
| Leader
|
Thomas Smartt
|
Frederic Creswell
|
| Party
|
Unionist
|
Labour
|
| Last election
|
19.42%, 39 seats
|
9.63%, 4 seats
|
| Seats won
|
25
|
21
|
| Seat change
|
14
|
17
|
| Popular vote
|
38,946
|
40,639
|
| Percentage
|
14.03%
|
14.65%
|
| Swing
|
5.39pp
|
5.01pp
|
|
|
1921 general election[edit]
1921 South African general election|
|
|
| Registered | 499,531 |
|---|
| Turnout | 277,742 (55.60%) |
|---|
|
|
|
1924 general election[edit]
1924 South African general election|
|
|
| Registered | 413,136 |
|---|
| Turnout | 319,047 (77.23%) |
|---|
|
|
|
1929 general election[edit]
1929 South African general election|
|
|
| Registered | 461,820 |
|---|
| Turnout | 347,924 (75.34%) |
|---|
|
|
First party
|
Second party
|
Third party
|
|
|
|
|

|
| Leader
|
Barry Hertzog
|
Jan Smuts
|
Walter Madeley
|
| Party
|
National
|
South African
|
Labour
|
| Last election
|
35.25%, 63 seats
|
47.04%, 53 seats
|
14.35%, 18 seats
|
| Seats won
|
78
|
61
|
8
|
| Seat change
|
15
|
8
|
10
|
| Popular vote
|
141,579
|
159,896
|
33,919
|
| Percentage
|
41.17%
|
46.50%
|
9.86%
|
| Swing
|
5.92pp
|
0.54pp
|
4.49pp
|
|
|
1933 general election[edit]
1933 South African general election|
|
|
| Registered | 957,636 |
|---|
| Turnout | 323,417 (33.77%) |
|---|
|
|
First party
|
Second party
|
|
|
|
|
| Leader
|
Barry Hertzog
|
Jan Smuts
|
| Party
|
National
|
South African
|
| Last election
|
41.17%, 78 seats
|
46.50%, 61 seats
|
| Seats won
|
75
|
61
|
| Seat change
|
3
|
 0 0
|
| Popular vote
|
101,159
|
71,486
|
| Percentage
|
31.61%
|
22.34%
|
| Swing
|
9.55pp
|
24.16pp
|
|
|
|
Third party
|
Fourth party
|
|
|
|
|
| Leader
|
Tielman Roos
|
Walter Madeley
|
| Party
|
Roos
|
Labour
|
| Last election
|
Did not exist
|
9.86%, 8 seats
|
| Seats won
|
2
|
2
|
| Seat change
|
New party
|
6
|
| Popular vote
|
27,441
|
20,276
|
| Percentage
|
8.58%
|
6.34%
|
| Swing
|
New party
|
3.52pp
|
|
|
1938 general election[edit]
1938 South African general election|
|
|
| Registered | 1,052,652 |
|---|
| Turnout | 835,378 (79.36%) |
|---|
|
|
First party
|
Second party
|
|
|
|

|
| Leader
|
Barry Hertzog
|
Daniël Malan
|
| Party
|
United
|
National
|
| Last election
|
53.95%, 136 seats
|
Did not exist
|
| Seats won
|
111
|
27
|
| Seat change
|
25
|
New party
|
| Popular vote
|
446,032
|
259,543
|
| Percentage
|
53.81%
|
31.31%
|
| Swing
|
0.14pp
|
New party
|
|
|
|
Third party
|
Fourth party
|
|
|

|
|
| Leader
|
Charles Stallard
|
Walter Madeley
|
| Party
|
Dominion
|
Labour
|
| Last election
|
Did not exist
|
6.34%, 2 seats
|
| Seats won
|
8
|
3
|
| Seat change
|
New party
|
1
|
| Popular vote
|
52,356
|
48,641
|
| Percentage
|
6.32%
|
5.87%
|
| Swing
|
New party
|
0.47pp
|
|
|
1943 general election[edit]
1943 South African general election|
|
|
| Registered | 1,114,110 |
|---|
| Turnout | 885,623 (79.49%) |
|---|
|
|
First party
|
Second party
|
|
|
|
|
| Leader
|
Jan Smuts
|
Daniël Malan
|
| Party
|
United
|
National
|
| Last election
|
53.81%, 111 seats
|
31.31%, 27 seats
|
| Seats won
|
89
|
43
|
| Seat change
|
22
|
16
|
| Popular vote
|
435,297
|
321,601
|
| Percentage
|
49.68%
|
36.70%
|
| Swing
|
4.13pp
|
5.39pp
|
|
|
|
Third party
|
Fourth party
|
|
|
|
|
| Leader
|
Walter Madeley
|
Charles Stallard
|
| Party
|
Labour
|
Dominion
|
| Last election
|
5.87%, 3 seats
|
6.32%, 8 seats
|
| Seats won
|
9
|
7
|
| Seat change
|
6
|
1
|
| Popular vote
|
38,206
|
29,023
|
| Percentage
|
4.36%
|
3.31%
|
| Swing
|
1.51pp
|
3.01pp
|
|
|
1948 general election[edit]
1948 South African general election|
|
|
| Registered | 1,337,534 |
|---|
| Turnout | 1,073,364 (80.25%) |
|---|
|
|
First party
|
Second party
|
|
|
|
|
| Leader
|
Daniël Malan
|
Jan Smuts
|
| Party
|
National
|
United
|
| Last election
|
36.70%, 43 seats
|
49.68%, 89 seats
|
| Seats won
|
70
|
65
|
| Seat change
|
27
|
24
|
| Popular vote
|
401,834
|
524,230
|
| Percentage
|
37.70%
|
49.18%
|
| Swing
|
1.00pp
|
0.50pp
|
|
|
|
Third party
|
Fourth party
|
|
|

|

|
| Leader
|
Nicolaas Havenga
|
John Christie
|
| Party
|
Afrikaner
|
Labour
|
| Last election
|
1.78%, 0 seats
|
4.36%, 9 seats
|
| Seats won
|
9
|
6
|
| Seat change
|
9
|
3
|
| Popular vote
|
41,885
|
27,360
|
| Percentage
|
3.93%
|
2.57%
|
| Swing
|
2.15pp
|
1.79pp
|
|
|
1953 general election[edit]
1953 South African general election|
|
|
| Registered | 1,385,591 |
|---|
| Turnout | 1,218,631 (87.95%) |
|---|
|
|
First party
|
Second party
|
Third party
|
|
|
|

|
|
| Leader
|
Daniël Malan
|
Jacobus Strauss
|
John Christie
|
| Party
|
National
|
United
|
Labour
|
| Last election
|
41.63%, 79 seats
|
49.18%, 65 seats
|
2.57%, 6 seats
|
| Seats won
|
94
|
57
|
5
|
| Seat change
|
15
|
8
|
1
|
| Popular vote
|
598,718
|
576,474
|
34,730
|
| Percentage
|
49.48%
|
47.65%
|
2.87%
|
| Swing
|
7.85pp
|
1.53pp
|
0.30pp
|
|
|
1958 general election[edit]
1958 South African general election|
|
|
| Registered | 1,563,426 |
|---|
| Turnout | 1,163,576 (74.42%) |
|---|
|
|
First party
|
Second party
|
|
|

|
|
| Leader
|
Johannes Strijdom
|
De Villiers Graaff
|
| Party
|
National
|
United
|
| Last election
|
49.48%, 94 seats
|
47.65%, 57 seats
|
| Seats won
|
103
|
53
|
| Seat change
|
9
|
4
|
| Popular vote
|
642,006
|
492,080
|
| Percentage
|
55.54%
|
42.57%
|
| Swing
|
6.06pp
|
5.08pp
|
|
|
Republic of South Africa[edit]
1961 general election[edit]
1961 South African general election|
|
|
| Registered | 1,811,160 |
|---|
| Turnout | 802,079 (44.55%) |
|---|
|
|
|
1966 general election[edit]
1966 South African general election|
|
|
| Registered | 1,901,479 |
|---|
| Turnout | 1,309,645 (68.48%) |
|---|
|
|
|
1970 general election[edit]
1970 South African general election|
|
|
| Registered | 2,161,234 |
|---|
| Turnout | 1,507,634 (74.35%) |
|---|
|
|
|
1974 general election[edit]
1974 South African general election|
|
|
| Registered | 2,232,623 |
|---|
| Turnout | 1,158,704 (51.87%) |
|---|
|
|
|
1977 general election[edit]
1977 South African general election|
|
|
| Registered | 2,193,635 |
|---|
| Turnout | 1,064,350 (48.52%) |
|---|
|
|
|
1981 general election[edit]
1981 South African general election|
|
|
| Registered | 2,290,626 |
|---|
| Turnout | 1,372,019 (59.90%) |
|---|
|
|
|
1987 general election[edit]
1987 South African general election|
|
|
| Registered | 3,031,414 |
|---|
| Turnout | 2,056,627 (67.84%) |
|---|
|
|
|
1989 general election[edit]
1989 South African general election|
|
|
| Registered | 3,120,104 |
|---|
| Turnout | 2,167,929 (69.48%) |
|---|
|
|
|
Republic after Apartheid[edit]
1994 general election[edit]
1994 South African general election|
|
|
|
| Registered | 22,709,152 |
|---|
| Turnout | 19,726,610 (86.87%) |
|---|
|
|
First party
|
Second party
|
Third party
|
|
|
|
|
|
| Leader
|
Nelson Mandela
|
Frederik de Klerk
|
Mangosuthu Buthelezi
|
| Party
|
ANC
|
NP
|
IFP
|
| Last election
|
Banned party
|
48.19%, 103 seats
|
Did not exist
|
| Seats won
|
252
|
82
|
43
|
| Seat change
|
New party
|
21
|
New party
|
| Popular vote
|
12,237,655
|
3,983,690
|
2,058,294
|
| Percentage
|
62.65%
|
20.39%
|
10.54%
|
| Swing
|
New party
|
27.80pp
|
New party
|
|
|
|
Fourth party
|
Fifth party
|
Sixth party
|
|
|
|
|
|
| Leader
|
Constand Viljoen
|
Zach de Beer
|
Clarence Makwetu
|
| Party
|
VF
|
DP
|
PAC
|
| Last election
|
Did not exist
|
20.00%, 34 seats
|
Banned party
|
| Seats won
|
9
|
7
|
5
|
| Seat change
|
New party
|
27
|
New party
|
| Popular vote
|
424,555
|
338,426
|
243,478
|
| Percentage
|
2.17%
|
1.73%
|
1.25%
|
| Swing
|
New party
|
18.27pp
|
New party
|
|
 Results by provinces |
|
1999 general election[edit]
1999 South African general election|
|
|
|
| Registered | 18,172,751 |
|---|
| Turnout | 16,228,462 (89.30%) |
|---|
|
|
First party
|
Second party
|
Third party
|
|
|
|
|
|
| Leader
|
Thabo Mbeki
|
Tony Leon
|
Mangosuthu Buthelezi
|
| Party
|
ANC
|
DP
|
IFP
|
| Last election
|
62.65%, 252 seats
|
1.73%, 7 seats
|
10.54%, 43 seats
|
| Seats won
|
266
|
38
|
34
|
| Seat change
|
14
|
31
|
9
|
| Popular vote
|
10,601,330
|
1,527,337
|
1,371,477
|
| Percentage
|
66.35%
|
9.56%
|
8.58%
|
| Swing
|
3.70pp
|
7.83pp
|
1.96pp
|
|
|
|
Fourth party
|
Fifth party
|
Sixth party
|
|
|
|
|
|
| Leader
|
Marthinus van Schalkwyk
|
Bantu Holomisa
|
Kenneth Meshoe
|
| Party
|
NNP
|
UDM
|
ACDP
|
| Last election
|
20.39%, 82 seats
|
Did not exist
|
0.45%, 2 seats
|
| Seats won
|
28
|
14
|
6
|
| Seat change
|
54
|
New party
|
4
|
| Popular vote
|
1,098,215
|
546,790
|
228,975
|
| Percentage
|
6.87%
|
3.42%
|
1.43%
|
| Swing
|
13.52pp
|
New party
|
0.98pp
|
|
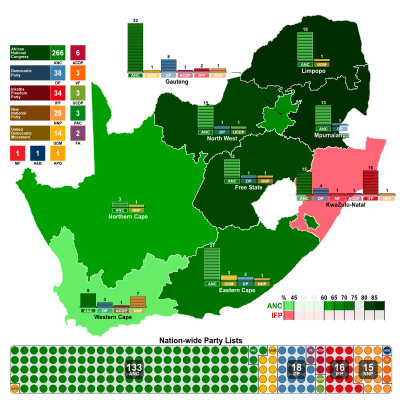 Results by provinces |
|
2004 general election[edit]
2004 South African general election|
|
|
|
| Registered | 20,674,926 |
|---|
| Turnout | 15,863,558 (76.70%) |
|---|
|
|
First party
|
Second party
|
Third party
|
|
|
|
|
|
| Leader
|
Thabo Mbeki
|
Tony Leon
|
Mangosuthu Buthelezi
|
| Party
|
ANC
|
DA
|
IFP
|
| Last election
|
66.35%, 266 seats
|
9.56%, 38 seats
|
8.58%, 34 seats
|
| Seats won
|
279
|
50
|
28
|
| Seat change
|
13
|
12
|
6
|
| Popular vote
|
10,880,915
|
1,931,201
|
1,088,664
|
| Percentage
|
69.69%
|
12.37%
|
6.97%
|
| Swing
|
3.34pp
|
2.81pp
|
1.61pp
|
|
|
|
Fourth party
|
Fifth party
|
Sixth party
|
|
|
|
|
|
| Leader
|
Bantu Holomisa
|
Patricia de Lille
|
Marthinus van Schalkwyk
|
| Party
|
UDM
|
ID
|
NNP
|
| Last election
|
3.42%, 14 seats
|
Did not exist
|
6.87%, 28 seats
|
| Seats won
|
9
|
7
|
7
|
| Seat change
|
5
|
New party
|
21
|
| Popular vote
|
355,717
|
269,765
|
257,824
|
| Percentage
|
2.28%
|
1.73%
|
1.65%
|
| Swing
|
1.14pp
|
New party
|
5.22pp
|
|
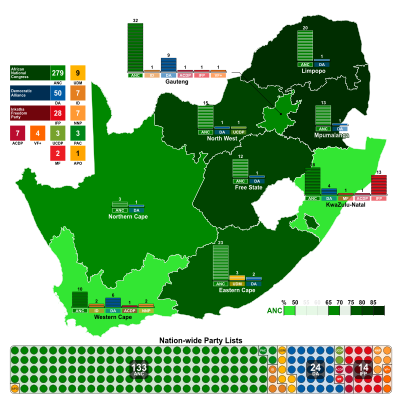 Results by provinces |
|
2009 general election[edit]
2009 South African general election|
|
|
|
| Registered | 23,181,997 |
|---|
| Turnout | 17,919,966 (77.30%) |
|---|
|
|
First party
|
Second party
|
Third party
|
|
|
|
|
|
| Leader
|
Jacob Zuma
|
Helen Zille
|
Mosiuoa Lekota
|
| Party
|
ANC
|
DA
|
COPE
|
| Last election
|
69.69%, 279 seats
|
12.37%, 50 seats
|
Did not exist
|
| Seats won
|
264
|
67
|
30
|
| Seat change
|
15
|
17
|
New party
|
| Popular vote
|
11,650,748
|
2,945,829
|
1,311,027
|
| Percentage
|
65.90%
|
16.66%
|
7.42%
|
| Swing
|
3.79pp
|
4.29pp
|
New party
|
|
|
|
Fourth party
|
Fifth party
|
Sixth party
|
|
|
|
|
|
| Leader
|
Mangosuthu Buthelezi
|
Patricia de Lille
|
Bantu Holomisa
|
| Party
|
IFP
|
ID
|
UDM
|
| Last election
|
6.97%, 28 seats
|
1.73%, 7 seats
|
2.28%, 9 seats
|
| Seats won
|
18
|
4
|
4
|
| Seat change
|
10
|
3
|
5
|
| Popular vote
|
804,260
|
162,915
|
149,680
|
| Percentage
|
4.55%
|
0.92%
|
0.85%
|
| Swing
|
2.42pp
|
0.81pp
|
1.43pp
|
|
 Results by provinces |
|
2014 general election[edit]
2014 South African general election|
|
|
|
| Registered | 25,388,082 |
|---|
| Turnout | 18,654,771 (73.48%) |
|---|
|
|
First party
|
Second party
|
Third party
|
|
|
|
|
|
| Leader
|
Jacob Zuma
|
Helen Zille
|
Julius Malema
|
| Party
|
ANC
|
DA
|
EFF
|
| Last election
|
65.90%, 264 seats
|
16.66%, 67 seats
|
Did not exist
|
| Seats won
|
249
|
89
|
25
|
| Seat change
|
15
|
22
|
New party
|
| Popular vote
|
11,436,921
|
4,091,584
|
1,169,259
|
| Percentage
|
62.15%
|
22.23%
|
6.35%
|
| Swing
|
3.75pp
|
5.57pp
|
New party
|
|
|
|
Fourth party
|
Fifth party
|
Sixth party
|
|
|
|
|
|
| Leader
|
Mangosuthu Buthelezi
|
Zanele Msibi
|
Bantu Holomisa
|
| Party
|
IFP
|
NFP
|
UDM
|
| Last election
|
4.55%, 18 seats
|
Did not exist
|
0.85%, 4 seats
|
| Seats won
|
10
|
6
|
4
|
| Seat change
|
8
|
New party
|
0
|
| Popular vote
|
441,854
|
288,742
|
184,636
|
| Percentage
|
2.40%
|
1.57%
|
1.00%
|
| Swing
|
2.15pp
|
New party
|
0.15pp
|
|
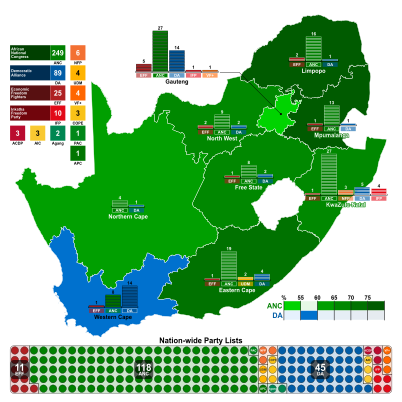 Results by provinces |
|
2019 general election[edit]
2019 South African general election|
|
|
|
| Registered | 26,756,649 |
|---|
| Turnout | 17,672,851 (66.05%) |
|---|
|
|
First party
|
Second party
|
Third party
|
|
|
|
|
|
| Leader
|
Cyril Ramaphosa
|
Mmusi Maimane
|
Julius Malema
|
| Party
|
ANC
|
DA
|
EFF
|
| Last election
|
62.15%, 249 seats
|
22.23%, 89 seats
|
6.35%, 25 seats
|
| Seats won
|
230
|
84
|
44
|
| Seat change
|
19
|
5
|
19
|
| Popular vote
|
10,026,475
|
3,622,531
|
1,882,480
|
| Percentage
|
57.50%
|
20.77%
|
10.80%
|
| Swing
|
4.65pp
|
1.46pp
|
4.45pp
|
|
|
|
Fourth party
|
Fifth party
|
Sixth party
|
|
|
|
|
|
| Leader
|
Mangosuthu Buthelezi
|
Pieter Groenewald
|
Kenneth Meshoe
|
| Party
|
IFP
|
VF+
|
ACDP
|
| Last election
|
2.40%, 10 seats
|
0.90%, 4 seats
|
0.57%, 3 seats
|
| Seats won
|
14
|
10
|
4
|
| Seat change
|
4
|
6
|
1
|
| Popular vote
|
588,839
|
414,864
|
146,262
|
| Percentage
|
3.38%
|
2.38%
|
0.84%
|
| Swing
|
0.98pp
|
1.48pp
|
0.27pp
|
|
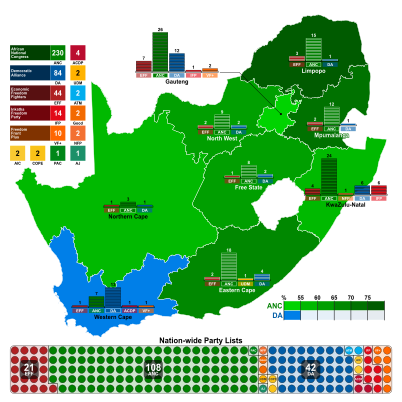 Results by provinces |
|
2024 general election[edit]
2024 South African general election|
|
|
|
| Registered | 27,782,081 |
|---|
| Turnout | 16,290,156 (58.64%) |
|---|
|
|
First party
|
Second party
|
Third party
|
|
|
|
|
|
| Leader
|
Cyril Ramaphosa
|
John Steenhuisen
|
Jacob Zuma
|
| Party
|
ANC
|
DA
|
MK
|
| Last election
|
57.50%, 230 seats
|
20.77%, 84 seats
|
Did not exist
|
| Seats won
|
159
|
87
|
58
|
| Seat change
|
71
|
3
|
New party
|
| Popular vote
|
6,459,683
|
3,505,735
|
2,344,309
|
| Percentage
|
40.18%
|
21.81%
|
14.58%
|
| Swing
|
17.32pp
|
1.04pp
|
New party
|
|
|
|
Fourth party
|
Fifth party
|
Sixth party
|
|
|
|
|
|
| Leader
|
Julius Malema
|
Velenkosini Hlabisa
|
Gayton McKenzie
|
| Party
|
EFF
|
IFP
|
PA
|
| Last election
|
10.80%, 44 seats
|
3.38%, 14 seats
|
0.04%, 0 seats
|
| Seats won
|
39
|
17
|
9
|
| Seat change
|
5
|
3
|
9
|
| Popular vote
|
1,529,961
|
618,207
|
330,425
|
| Percentage
|
9.52%
|
3.85%
|
2.06%
|
| Swing
|
1.28pp
|
0.47pp
|
2.02pp
|
|
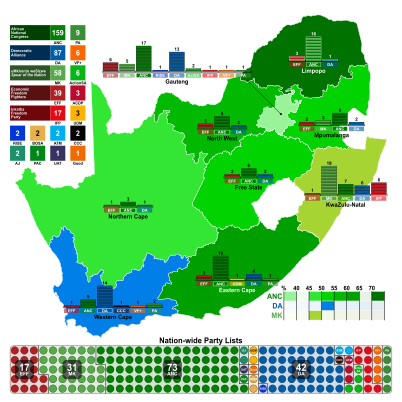 Results by provinces |
|
Republic after Apartheid[edit]
1994 general election[edit]
1994 South African general election|
|
|
400 seats in the National Assembly
201 seats needed for a majority |
| Turnout | 19,726,610 (86.87%) |
|---|
|
This lists parties that won seats. See the complete results below.  Results by province |
|
1999 general election[edit]
1999 South African general election|
|
|
400 seats in the National Assembly
201 seats needed for a majority |
| Turnout | 16,228,462 (89.30%) |
|---|
|
This lists parties that won seats. See the complete results below.  Results by province |
|
2004 general election[edit]
2004 South African general election|
|
|
400 seats in the National Assembly
201 seats needed for a majority |
| Turnout | 15,863,558 (76.70%) |
|---|
|
This lists parties that won seats. See the complete results below.  Results by province |
|
2009 general election[edit]
2009 South African general election|
|
|
400 seats in the National Assembly
201 seats needed for a majority |
| Turnout | 17,919,966 (77.30%) |
|---|
|
This lists parties that won seats. See the complete results below. 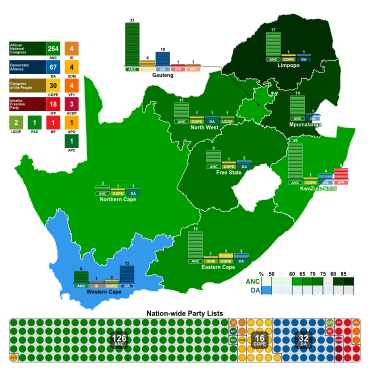 Results by province |
|
2014 general election[edit]
2014 South African general election|
|
|
400 seats in the National Assembly
201 seats needed for a majority |
| Turnout | 18,654,771 (73.48%) |
|---|
|
This lists parties that won seats. See the complete results below.  Results by province |
|
2019 general election[edit]
2019 South African general election|
|
|
400 seats in the National Assembly
201 seats needed for a majority |
| Turnout | 17,672,851 (66.05%) |
|---|
|
This lists parties that won seats. See the complete results below.  Results by province |
|
2024 general election[edit]
2024 South African general election|
|
|
400 seats in the National Assembly
201 seats needed for a majority |
| Turnout | 16,290,156 (58.64%) |
|---|
|
This lists parties that won seats. See the complete results below.  Results by province |
|


.jpg)

.jpg)
.jpg)
.jpg)

.jpg)
.jpg)
.jpg)

.jpg)
.jpg)

.jpg)
.jpg)

.jpg)


.png)


.jpg)

.jpg)


.png)


.jpg)
.jpg)

.png)
_(cropped).jpg)

.jpg)
.jpg)


.jpg)
.jpg)
.png)